
 (
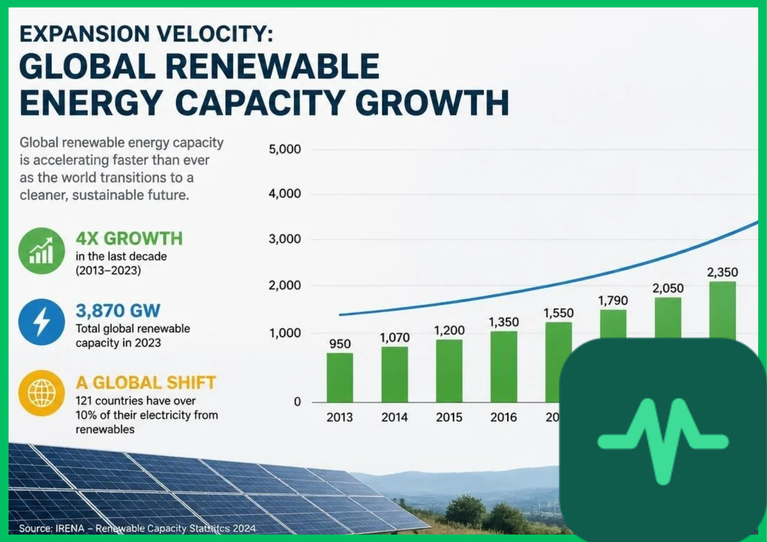
 ) between 2026 and 2031, representing a 57% acceleration compared to the preceding six-year period. As geopolitical energy security priorities and climate commitments drive rapid power system transformation, solar photovoltaic (PV) and onshore wind technologies continue to scale at unprecedented velocities. Analyzing macro-level capacity expansion benchmarks, regional deployment shifts, and grid integration bottlenecks is essential for evaluating long-term clean energy transition trajectories.
Global Deployment Velocity and Technology Expansion Benchmarks
The foundational metric defining contemporary renewable energy expansion is cumulative capacity addition velocity across utility-scale and decentralized generation assets. Total global renewable electricity capacity is projected to expand by nearly 85% between 2025 and 2031, elevating the share of renewables in global electricity generation from 33% to nearly 45%. Solar photovoltaic technology accounts for more than three-quarters of this aggregate growth, driven by plummeting levelized costs of electricity (LCOE) and rapid modular installation timelines.
Solar PV deployment velocities have surpassed all historical energy infrastructure scaling rates, overtaking hydropower to become the world's largest source of renewable electricity capacity. Simultaneously, cumulative onshore and offshore wind capacity is projected to exceed  (
 ) globally by 2031. While early clean energy expansion was concentrated primarily within advanced economies and a few dominant manufacturing nations, recent IEA analytical data indicates a structural shift toward broader geographical distribution. Emerging markets across Asia-Pacific, Latin America, the Middle East, and sub-Saharan Africa are accelerating renewable deployment to insulate domestic economies from fossil-fuel price volatility and import dependency.
Technical Data Specifications of Global Renewable Capacity Growth Parameters
| Renewable Capacity Growth Parameter | Quantitative Engineering & Market Benchmark |
|---|---|
| Projected Global Capacity Addition (2026–2031) | Almost  (  ) total deployment |
| Growth Velocity Increase vs. Prior Period | 57% expansion acceleration over 2020–2025 baseline |
| Solar Photovoltaic Share of Growth |  of total projected renewable additions |
| Projected Global Renewable Electricity Share |  of total power generation by 2031 |
| Onshore and Offshore Wind Capacity Target | 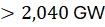 cumulative global capacity by 2031 |
| Variable Renewable Energy (VRE) Penetration | Over 28% combined wind and solar grid penetration |
| Emerging Market Deployment Parity | Non-China emerging economies match advanced market growth |
Variable Renewable Energy (VRE) Integration and Grid Flexibility
As global renewable capacity growth accelerates variable renewable energy (VRE) penetration—combining solar PV and wind generation to supply over 28% of total electricity generation globally—power systems face critical grid integration challenges. Unlike synchronous thermal generation plants (coal, natural gas, and nuclear) that provide massive rotational inertia and predictable baseline power output, solar and wind assets exhibit intermittent power profiles governed by meteorological conditions and diurnal cycles.
Without commensurate investments in transmission infrastructure, energy storage systems, and demand-side flexibility, high VRE penetration induces severe operational bottlenecks:
- Power Curtailment: Unmanaged generation spikes during peak solar irradiation intervals exceed local transmission line ampacity limits, forcing grid operators to curtail renewable energy production and waste clean generation potential.
- Frequency Instability: Rapid drops in variable generation—such as sudden cloud cover over large solar photovoltaic arrays—require fast-responding grid-forming inverters and utility-scale battery energy storage systems (BESS) to provide synthetic inertia and primary frequency response within milliseconds.
According to IEA grid modernization assessments, expanding transmission grid capacity and deploying automated digital substation controls are mandatory to prevent curtailment losses and ensure transmission network stability.
Decentralized Off-Grid Systems and Rural Electrification Velocity
Beyond utility-scale transmission corridors, global renewable capacity growth is expanding rapidly via decentralized off-grid and mini-grid architectures. In developing regions across sub-Saharan Africa and South Asia, modular solar photovoltaic systems combined with lithium-ion or lead-carbon battery storage provide reliable electrification to tens of millions of households lacking access to centralized transmission grids.
Off-grid solar PV capacity is projected to expand significantly, driven by low capital expenditure thresholds, rapid deployment timelines, and high reliability. Decentralized commercial and industrial (C&I) rooftop solar installations also reduce transmission line congestion, supplying high-demand commercial centers and emerging data center loads directly at the point of consumption without requiring multi-kilometer high-voltage transmission line construction.
Economic Competitiveness and Levelized Cost Dynamics
The primary economic driver underpinning global renewable capacity growth velocity is the dramatic reduction in levelized cost of electricity (LCOE) achieved across wind and solar technologies over the past decade. Photovoltaic module manufacturing efficiencies, larger silicon wafer formats, and higher-output bifacial panels have lowered utility-scale solar LCOE below fossil-fuel generation costs in most global markets.
According to UNEP and International Renewable Energy Agency (IRENA) economic analyses, over 90% of newly commissioned renewable power projects globally generate electricity at a lower cost than the cheapest fossil-fuel alternatives. This cost superiority decouples clean energy deployment from government subsidy reliance, establishing self-sustaining market momentum. Consequently, industrial energy consumers and municipal utilities are procuring renewable power directly via long-term corporate power purchase agreements (PPAs), accelerating the retirement of high-emitting coal and gas-fired generation assets.
The Final Take
Mastering global renewable energy capacity growth velocity confirms the structural transition of international power systems toward low-carbon generation architectures. Citing IEA market reports and UNEP assessments, deploying nearly  of new renewable capacity through 2031 requires aligning aggressive solar and wind scaling with robust grid flexibility investments and battery storage integration. By overcoming transmission bottlenecks and prioritizing decentralized energy resilience, global renewable capacity expansion establishes an indispensable foundation for universal net-zero decarbonization.

Comments (0)
Login to leave a comment.
No comments yet. Be the first to share your thoughts!