
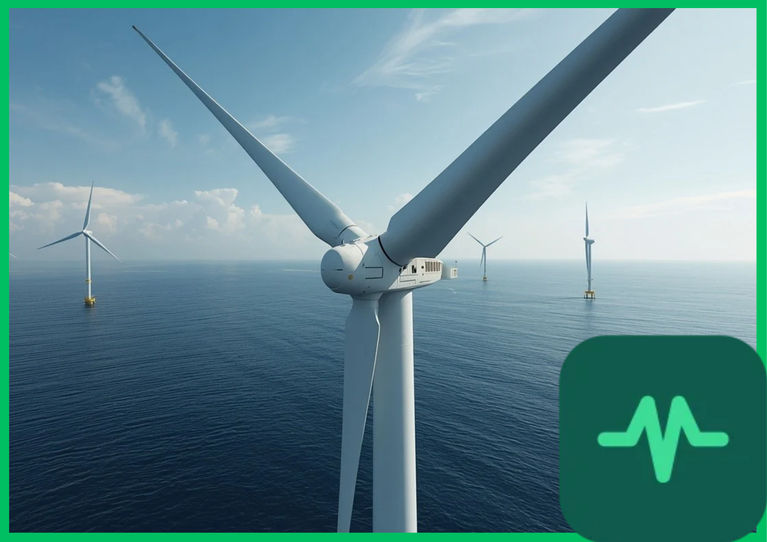
Rain Droplet Impact Physics and Leading-Edge Velocity Dynamics
The foundational physical mechanism governing offshore wind turbine blade erosion is high-velocity liquid droplet impact fatigue. As offshore wind turbine rotors spin, peripheral blade tip speeds reach extreme rotational velocities exceeding 80 m/s to 100 m/s (288 km/h to 360 km/h [179 mph to 224 mph]). When blades operating at these velocities encounter falling atmospheric rain droplets, hail, or saline spray, the instantaneous impact pressure generates severe waterhammer shockwaves and high shear stresses along the leading-edge profile.
The peak waterhammer pressure ( ) generated during liquid droplet impact is formulated mathematically by the waterhammer equation:

where  represents water density (
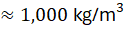 [
 ]),
 is the acoustic sound velocity in water (
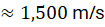 [
 ]), and
 is the normal component of droplet impact velocity.
At tip speeds approaching 90 m/s, localized impact pressures exceed 130 MPa (18,850 psi)—far exceeding the tensile yield and fatigue thresholds of standard polyurethane topcoats and epoxy resin matrix composites. Repeated cyclic impacts induce micro-cracking, coating delamination, and progressive pitting along the outer 20% to 30% of the blade span near the tip.
Aerodynamic Drag Penalties and Boundary Layer Separation
Once leading-edge erosion breaches protective coatings and creates surface pits, roughness heights ( ) increase dramatically, altering local boundary layer airflow dynamics. A smooth offshore wind turbine blade maintains laminar boundary-layer flow across the forward aerofoil section before transitioning to a controlled turbulent boundary layer downstream of the pressure minimum.
When leading-edge roughness increases due to droplet erosion pitting, boundary-layer transition occurs prematurely near the leading edge. This early transition thickens the turbulent boundary layer, causing flow separation and a severe increase in aerodynamic profile drag. Lift-to-drag ratios ( ) degrade by 5% to 20%, reducing total aerodynamic torque output.
The resulting power loss ( ) directly impacts annual energy production (AEP), reducing overall turbine electricity yield by 3% to 6% across typical marine operating wind regimes. Furthermore, asymmetric blade erosion across multi-megawatt rotor blades induces aerodynamic imbalance, generating structural cyclic vibrations that accelerate gearbox and main bearing fatigue wear.
Technical Data Specifications of Offshore Wind Blade Erosion Parameters
| Offshore Wind Erosion Parameter | Engineering Specification Standard |
|---|---|
| Rotor Blade Tip Speed Velocity |  to  (  [ 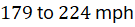 ]) |
| Peak Waterhammer Impact Pressure |  ( 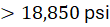 ) at 90 m/s tip speed |
| Annual Energy Production (AEP) Loss | 3% to 6% reduction due to severe leading-edge roughness |
Lift-to-Drag Ratio ( ) Degradation | 5% to 20% reduction across outer blade span |
| Protective Coating Material Base | Polyurethane elastomers and polyurea composite layers |
| Offshore Turbine Power Capacity |  to  rated output generation |
| Standard Rotor Diameter Scale |  to  ( 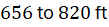 ) tip-to-tip |
Leading-Edge Protection (LEP) Material Science and Engineering
Mitigating droplet impact erosion requires advanced leading-edge protection (LEP) coating systems applied during blade manufacturing or retrofitted via specialized offshore robotic access platforms. Modern LEP systems utilize high-performance elastomeric polyurethane tapes, sprayed polyurea coatings, or multi-layer polyurethane liquid films possessing high elongation-at-break values (300% to 600%) and exceptional tear resistance.
Elastomeric LEP coatings absorb and dissipate incoming kinetic impact energy elastically, dampening waterhammer shockwaves before stresses reach the underlying glass-fiber-reinforced polymer (GFRP) or carbon-fiber-reinforced polymer (CFRP) structural spar caps. However, marine environmental exposure—including intense ultraviolet (UV) radiation, cyclic salt-fog corrosion, and sub-zero thermal fluctuations—induces polymer chain embrittlement over time, reducing elastomeric impact absorption capacity and requiring periodic offshore maintenance.
Computational Fluid Dynamics (CFD) Modeling of Roughness Effects
Quantifying the operational impact of blade erosion requires advanced computational fluid dynamics (CFD) modeling coupled with rotating blade boundary-layer solvers. Automotive and wind turbine engineers utilize Reynolds-Averaged Navier-Stokes (RANS) simulations integrated with roughness-modified turbulence models (such as the Spalart-Allmaras or shear-stress transport  models) to predict aerodynamic performance degradation.
CFD models simulate how localized pitting depths ( to
 [
 ]) trigger premature flow separation across specific radial sections. By mapping surface roughness distributions against real-time supervisory control and data acquisition (SCADA) power curve telemetry, wind farm operators optimize operations and schedule targeted blade leading-edge repair campaigns before severe structural fatigue occurs.
Comments (0)
Login to leave a comment.
No comments yet. Be the first to share your thoughts!