
 by 2030 to satisfy long-term climate targets. Unlike fossil fuel extraction projects characterized by high operational expenditures (OpEx) tied to volatile commodity markets, renewable energy generation assets exhibit high upfront capital expenditures (CapEx) coupled with near-zero marginal operating costs. Financing these capital-intensive infrastructural assets requires advanced financial engineering, rigorous levelized cost of energy forecasting, and structured risk-mitigation frameworks to lower project-level weighted average cost of capital (WACC).
Levelized Cost of Energy (LCOE) Forecasting and Capital Intensity
Evaluating clean energy project viability requires precise mathematical modeling of the levelized cost of energy ( ), which calculates the net present value of total lifetime costs divided by total lifetime electricity generation expressed in megawatt-hours (
 ):
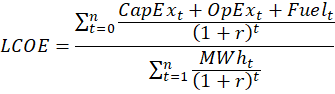
where  represents initial construction and equipment capital expenditures,
 denotes annual maintenance expenses,
 equals zero for wind and solar assets,
 is annual electricity generation, and
 represents the discount rate over operational lifespan
 (typically 25 to 30 years).
Because clean energy assets front-load their capital requirements during construction phases, financial risk models are highly sensitive to discount rate fluctuations. A minor increase in project financing rates elevates the LCOE of capital-intensive assets like offshore wind farms or utility-scale battery storage disproportionately compared to natural gas combustion turbines. Consequently, clean tech project financing depends on risk-reduction mechanisms that compress the discount rate, ensuring long-term financial viability.
Renewable Asset Discount Rates and Weighted Average Cost of Capital (WACC)
The weighted average cost of capital ( ) dictates the hurdle rate required by institutional investors, commercial banks, and equity partners financing clean energy infrastructure. The
 is calculated via:

where  represents total equity value,
 represents total debt value,
 is total capital capitalization,
 is the cost of equity,
 is the cost of debt, and
 is the corporate tax rate.
In emerging markets and nascent clean technology sectors (such as floating offshore wind, green hydrogen electrolysis, or direct air capture), perceived technological, regulatory, and offtake risks elevate the cost of equity ( ) and debt (
 ), driving
 values above 10% to 12%. High financing costs severely penalize capital-intensive assets, increasing levelized energy costs by 30% to 50%. De-risking strategies aim to compress
 values down to 4% to 6% by transferring construction, operational, and market risks to institutional guarantors or long-term contractual structures.
Structured Financial Instruments and Revenue Hedging
Mitigating investment risk in clean energy portfolios relies on standardized commercial contracts and credit enhancement instruments. Wholesale electricity markets introduce merchant price volatility, where spot prices fluctuate based on hourly generation supply and transmission congestion. To eliminate merchant price exposure, project developers execute long-term Power Purchase Agreements (PPAs) with creditworthy corporate offtakers or state-backed utilities.
PPAs establish a fixed strike price ( ) over 15- to 25-year operational periods, guaranteeing predictable cash flow generation. This revenue certainty enables project developers to achieve high debt-to-equity leverage ratios (often 75% debt to 25% equity), lowering overall capital costs. Furthermore, multilateral development banks and sovereign green banks deploy blended finance structures—including first-loss equity tranches, political risk insurance, and sovereign guarantees—to absorb localized default risks, unlocking private capital deployment in developing economies.
Technical Data Specifications of Clean Energy Investment Parameters
| Financial & Economic Parameter | Industry Specification Range |
|---|---|
| Typical Project Debt-to-Equity Ratio | 70:30 to 80:20 debt-to-equity financing |
| Target Project WACC (Mature Markets) | 4.0% to 6.5% discount rate |
| Target Project WACC (Emerging Markets) | 9.0% to 14.0% unmitigated risk rate |
| Power Purchase Agreement (PPA) Tenor | 15 to 25 years fixed-price contract duration |
| Debt Service Coverage Ratio (DSCR) | 1.15 to 1.35 minimum operating threshold |
| Utility-Scale Solar CapEx Benchmark | 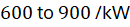 installed DC capacity |
| Offshore Wind CapEx Benchmark |  installed capacity |
Capital Allocation Decarbonization and Portfolio Optimization
Institutional asset managers execute portfolio decarbonization strategies by balancing asset risk-adjusted returns against greenhouse gas emissions intensity metrics. Portfolio optimization models utilize modern portfolio theory (MPT) adapted for energy assets, factoring in weather-driven generation correlation coefficients between wind, solar, and hydroelectric portfolios.
Diversifying clean energy generation assets geographically and technologically reduces aggregate cash flow variance. For example, combining onshore wind assets possessing nocturnal generation peaks with daytime solar photovoltaic installations flattens aggregate generation profiles, mitigating spot-market price cannibalization during midday hours of high solar supply.
Stranded Asset Risk and Macroeconomic Resilience
Quantitative financial analyses published by the IEA and academic financial research consortia emphasize the critical importance of factoring stranded asset risk into long-term capital allocation models. Allocating capital toward unabated fossil fuel infrastructure exposes investors to severe capital write-downs as carbon pricing mechanisms, regulatory phase-outs, and rapid cost declines in clean technologies accelerate economic obsolescence.
Conversely, channeling capital into resilient clean energy portfolios backed by robust risk-mitigation frameworks secures stable long-term yields while advancing global decarbonization pathways. By aligning financial structures with technical engineering realities, clean energy investment models ensure efficient capital deployment across global energy markets.




Comments (0)
Login to leave a comment.
No comments yet. Be the first to share your thoughts!