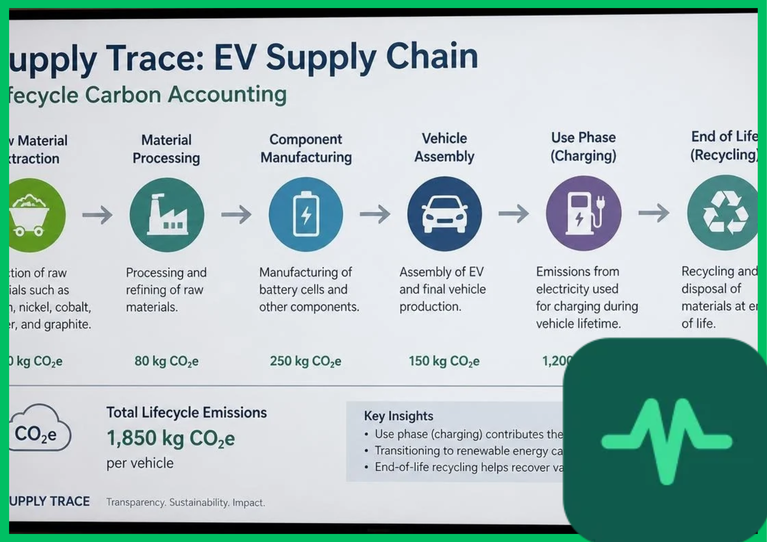
 ) emissions than producing an equivalent internal combustion engine vehicle, driven primarily by energy-intensive battery cell production and critical mineral refining. Establishing transparent product carbon footprints (PCFs) requires rigorous adherence to standardized life-cycle assessment (LCA) methodologies, tracing raw material extraction, chemical processing, cell fabrication, and final vehicle assembly across global supply chains.
Cradle-to-Gate System Boundaries and Life-Cycle Assessment Standards
Quantifying the total carbon footprint of an electric vehicle requires strict delineation of system boundaries codified under international standards such as ISO 14040 and ISO 14044. Cradle-to-gate carbon accounting evaluates all greenhouse gas emissions generated from initial raw material acquisition in the Earth's crust up to the completion of final vehicle manufacturing before consumer retail delivery.
The life-cycle assessment framework partitions manufacturing impacts into distinct modules:
- Raw Material Extraction and Refining (Module A1): Quantifies emissions from mining operations, ore beneficiation, and hydrometallurgical or pyrometallurgical refining of critical battery metals, including lithium, cobalt, nickel, and manganese.
- Component Manufacturing and Cell Fabrication (Modules A2-A3): Evaluates energy-intensive cathode active material (CAM) synthesis, anode graphitization, electrode coating, electrolyte formulation, and lithium-ion cell winding, stacking, and thermal formation.
- Vehicle Assembly and Powertrain Integration (Module A4): Measures direct and indirect energy inputs required for stamping steel or aluminum body panels, structural chassis welding, battery pack assembly, and final vehicle integration.
Without standardized system boundaries, cross-border supply chain variations obscure true manufacturing carbon intensities, undermining regulatory compliance and decarbonization targets.
Critical Mineral Refining and Battery Cell Production Emissions
The most carbon-intensive phase of electric vehicle manufacturing occurs upstream within the battery supply chain. Lithium-ion battery packs—accounting for 30% to 50% of total vehicle manufacturing emissions—require high-purity chemical processing that consumes massive thermal and electrical energy inputs.
Refining critical minerals involves distinct chemical pathways and associated carbon intensities:
- Lithium Processing: Extracting lithium via hard-rock spodumene calcining requires high-temperature rotary kilns operating at
 to
 (
 to
 ), burning natural gas or coal and generating significant greenhouse gas emissions compared to brine evaporation extraction.
- Graphite Graphitization: Anode-grade synthetic graphite manufacturing requires thermal graphitization furnaces operating at graphitization temperatures exceeding
 (
 ), resulting in high electrical energy consumption ranging from
 to
 of electricity per kilogram of finished graphite.
- Cathode Synthesis: Co-precipitating nickel, manganese, and cobalt sulfates into layered metal oxide precursors requires chemical precipitation reactors and high-temperature calcination in oxygen atmospheres.
Facility-level emissions depend directly on the carbon intensity of the local electrical grid supplying the refining and cell manufacturing plants. Facilities powered by coal-dominant electrical grids exhibit carbon intensities per kilowatt-hour of battery storage exceeding  , whereas facilities powered by hydroelectric, geothermal, or wind energy purchase agreements (PPAs) reduce cell manufacturing emissions by 60% to 80%.
Technical Data Specifications of Supply Chain Carbon Accounting Parameters
| Supply Chain & LCA Parameter | Engineering Specification Standard |
|---|---|
| Lifecycle Assessment Standard | ISO 14040 / ISO 14044 cradle-to-gate framework |
| Battery Manufacturing Carbon Intensity |  to 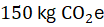 per kWh of battery capacity |
| Synthetic Graphite Graphitization Temp |  (  ) thermal treatment |
| Spodumene Ore Calcining Temperature |  to  (  to  ) |
| Global Warming Potential Metric | 100-year horizon ( ) per IPCC assessment reports |
| Primary Data Audit Standard | ISO 14065 greenhouse gas verification accreditation |
| EV Upstream Manufacturing Footprint |  to  total upfront production emissions |
Traceability Protocols, Digital Passports, and Data Verification
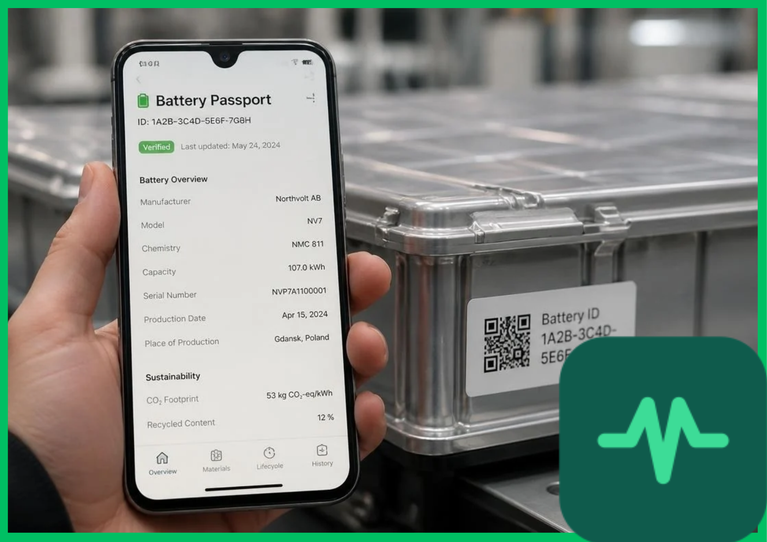
Ensuring integrity across global electric vehicle supply chains requires transitioning from generalized economic input-output models to primary facility-level data tracking. Traceability protocols utilize blockchain ledgers, cryptographic tokens, and digital battery passports to record immutable chain-of-custody data from the mine site to the showroom floor.
Digital battery passports document precise material provenance, tracking recycled content percentages, hazardous chemical compositions, and verified product carbon footprints (PCFs). Third-party auditing bodies execute independent data verification, confirming that suppliers adhere to strict environmental, social, and governance (ESG) reporting standards. When primary facility data is absent, regulatory frameworks apply conservative default emission factors carrying severe penalty margins, motivating upstream raw material processors to adopt transparent, verifiable carbon accounting systems.
Carbon Payback Timelines and Well-to-Wheel Offset Dynamics
Because electric vehicle manufacturing generates a higher upfront carbon footprint than internal combustion vehicle production—averaging  to
 (
 ) of
 for the battery pack alone—evaluating environmental net benefit requires calculating carbon payback timelines.
Carbon payback represents the operational distance or operating duration required for a battery-electric vehicle's zero tailpipe emissions to offset its higher manufacturing deficit relative to a comparable internal combustion vehicle. Well-to-wheel lifecycle assessments published by the IEA and UNEP demonstrate that when charged using low-carbon electricity grids, electric vehicles achieve full carbon payback within 1.5 to 3 years of normal driving operation (approximately  to
 [
 ]). Following this initial payback window, the vehicle operates with net-negative cumulative emissions growth relative to fossil-fueled alternatives across its remaining 10-to-15-year operational lifespan.
The Final Take
Mastering electric vehicle supply chain lifecycle carbon accounting establishes the quantitative transparency required to minimize upstream manufacturing emissions. Citing International Energy Agency critical mineral assessments and UNEP industrial frameworks, standardizing ISO life-cycle methodologies, tracking mineral provenance via digital battery passports, and transitioning refining facilities to renewable energy grids reduces cradle-to-gate carbon footprints. By enforcing rigorous product carbon footprint verification, the global electric vehicle industry ensures sustainable, low-carbon manufacturing from raw mineral extraction to final vehicle recycling.
Comments (0)
Login to leave a comment.
No comments yet. Be the first to share your thoughts!